As we come to our last days at sea on the
I09N cruise, it’s time to highlight some of the CO2 analyses being
done at sea. Carbon dioxide (CO2)
is a greenhouse gas – which effectively insulates the Earth by trapping some of
the outgoing radiation in our atmosphere - but it’s also involved in photosynthesis,
respiration, and metabolism – life-sustaining processes for plants and
animals. Opposite to us, plants take in
CO2 gas and respire out O2, and if you remember from
previous posts - marine plants provide ½ of all the O2 in the
atmosphere! So the uptake and
transformations of CO2 in the ocean plays a major role in setting our
climate.
Nature works towards balance, and gases
like CO2, O2, and CFCs are distributed between the ocean,
atmosphere, and land to find that balance.
However, over the last few hundred years (i.e., the Industrial
Revolution), fossil fuel burning has released CO2 into the
atmosphere at an unprecedented pace. In
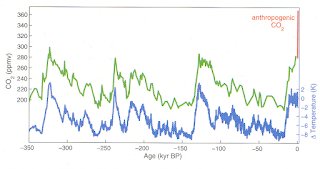
the figure below, air space in ice cores from Antarctica reveal how temperature
and atmospheric CO2 have risen and fallen over the last 350 thousand
years (glacial-interglacial transitions).
Modern values (shown in red) can be attributable to anthropogenic (man-made)
emissions. Today’s global average
atmospheric concentration of CO2 is over 400ppm – off the geologic
charts!
 |
| [Inferred temperature change and atmospheric CO2 concentration from the Vostok Ice Core in East Antarctica, over the last 350 thousand years (data taken from Petit, et al., 1999, Nature). Modern CO2 values shown in red can be attributable to anthropogenic emissions. More at http://cdiac.ornl.gov/trends/co2/ice_core_co2.html] |
Now we are investigating how the Earth’s
reservoirs (ocean, atmosphere, land) will respond to the massive release of CO2
from fossil fuel burning. The figure
below details the global flows of carbon between the different reservoirs. The arrows show rates of transfer, and the
boxes show total concentrations of carbon in each reservoir. While the burning of coal, oil, and gas sends
carbon only in one direction (source), the ocean, atmosphere, and plants/soil exchange
carbon, acting as sources and sinks. Note
how the surface ocean takes up slightly more carbon than it releases (>100
PgC/y) – the ocean is an overall sink for CO2. However, the deep ocean and ocean sediments hold
the greatest proportion of carbon (40,000 PgC).
Getting carbon from the surface to the deep ocean, then, is key to
removing CO2 from the atmosphere, and combating the effects of
climate change. This is dependent on the
inorganic and biologic transformations of carbon in the ocean, and the movement
of water masses in global ocean circulation.
 |
|
|
Currently, the ocean absorbs ¼ of all
anthropogenic carbon. In the ocean, CO2
reacts with water and this increases the acidity – a phenomenon termed Ocean Acidification. Actually, due to the various salts dissolved
in seawater, the ocean is slightly alkaline (average pH of surface ocean is
8.1, while a pH<7 is acidic, and pH>7 is alkaline). However, the oceans will continue to absorb the
excess anthropogenic carbon for many years to come. Ocean acidification
has been shown to impact marine life in various ways, from effecting physiological
functions to reducing growth rates and survival, and has rapid impacts for
calcifying organisms like coral and some plankton.
A number of scientists on-board this
cruise are taking different approaches to measure CO2 in the Indian
Ocean. Ellen Briggs, David Cervantes, and
Stephanie Mumma measure the total alkalinity (TA) and pH of seawater. Ellen, below, is a PhD student in her final
year from UCSD-SIO. She is also
collecting samples to test out a sensor that can measure alkalinity autonomously,
which she developed for her PhD thesis.
 |
|
[Ellen Briggs (UCSD-SIO) measures the
alkalinity of seawater in the Main Lab.]
|
[Bob Castle (NOAA-AOML) prepares a moisture
stripper for measuring DIC.]
The four carbonate parameters (TA, pH, DIC, and pCO2 - which is measured with an autonomous system on-board) are needed to fully characterize the carbonate system in the ocean.
All of the analyses of this cruise provide
data that are essential for understanding the ocean’s potential for uptake,
transfer, and storage of CO2.
The US GO-SHIP repeat hydrography program affords us the ability to sail
the seas and collect the much needed data for understanding the current state
of the ocean and the ocean’s response to a changing climate. Thanks to all the scientists, engineers, and
crew members for working so hard to make this cruise a success!! Till next time J


No comments:
Post a Comment