Sunday, April 24, 2016

CO2 Uptake by the Ocean


As we come to our last days at sea on the I09N cruise, it’s time to highlight some of the CO2 analyses being done at sea.  Carbon dioxide (CO2) is a greenhouse gas – which effectively insulates the Earth by trapping some of the outgoing radiation in our atmosphere - but it’s also involved in photosynthesis, respiration, and metabolism – life-sustaining processes for plants and animals.  Opposite to us, plants take in CO2 gas and respire out O2, and if you remember from previous posts - marine plants provide ½ of all the O2 in the atmosphere!  So the uptake and transformations of CO2 in the ocean plays a major role in setting our climate. 

Nature works towards balance, and gases like CO2, O2, and CFCs are distributed between the ocean, atmosphere, and land to find that balance.  However, over the last few hundred years (i.e., the Industrial Revolution), fossil fuel burning has released CO2 into the atmosphere at an unprecedented pace.  In the figure below, air space in ice cores from Antarctica reveal how temperature and atmospheric CO2 have risen and fallen over the last 350 thousand years (glacial-interglacial transitions).  Modern values (shown in red) can be attributable to anthropogenic (man-made) emissions.  Today’s global average atmospheric concentration of CO2 is over 400ppm – off the geologic charts! 

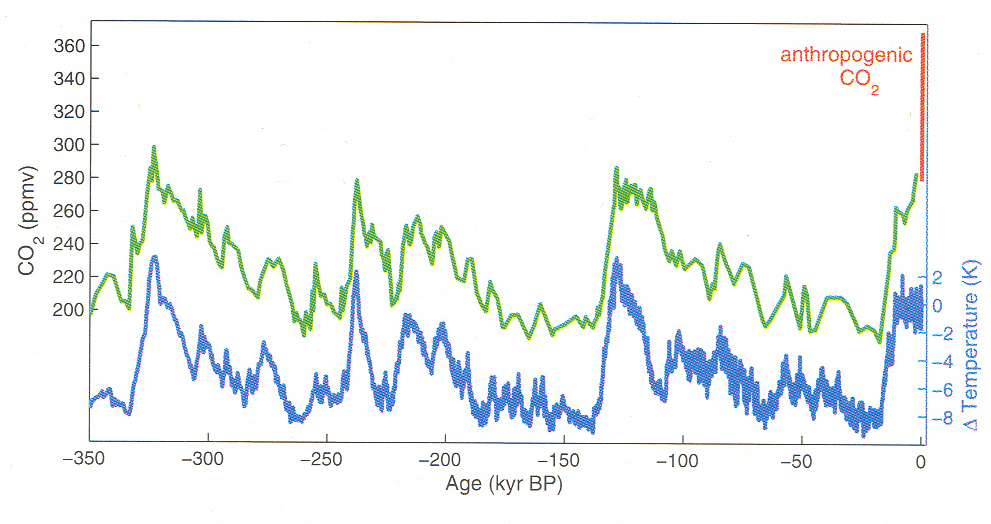
[Inferred temperature change and atmospheric CO2 concentration from the Vostok Ice Core in East Antarctica, over the last 350 thousand years (data taken from Petit, et al., 1999, Nature).  Modern CO2 values shown in red can be attributable to anthropogenic emissions.  More at http://cdiac.ornl.gov/trends/co2/ice_core_co2.html]
 
Now we are investigating how the Earth’s reservoirs (ocean, atmosphere, land) will respond to the massive release of CO2 from fossil fuel burning.  The figure below details the global flows of carbon between the different reservoirs.  The arrows show rates of transfer, and the boxes show total concentrations of carbon in each reservoir.  While the burning of coal, oil, and gas sends carbon only in one direction (source), the ocean, atmosphere, and plants/soil exchange carbon, acting as sources and sinks.  Note how the surface ocean takes up slightly more carbon than it releases (>100 PgC/y) – the ocean is an overall sink for CO2.  However, the deep ocean and ocean sediments hold the greatest proportion of carbon (40,000 PgC).  Getting carbon from the surface to the deep ocean, then, is key to removing CO2 from the atmosphere, and combating the effects of climate change.  This is dependent on the inorganic and biologic transformations of carbon in the ocean, and the movement of water masses in global ocean circulation.


Currently, the ocean absorbs ¼ of all anthropogenic carbon.  In the ocean, CO2 reacts with water and this increases the acidity – a phenomenon termed Ocean Acidification.  Actually, due to the various salts dissolved in seawater, the ocean is slightly alkaline (average pH of surface ocean is 8.1, while a pH<7 is acidic, and pH>7 is alkaline).  However, the oceans will continue to absorb the excess anthropogenic carbon for many years to come.  Ocean acidification has been shown to impact marine life in various ways, from effecting physiological functions to reducing growth rates and survival, and has rapid impacts for calcifying organisms like coral and some plankton.

A number of scientists on-board this cruise are taking different approaches to measure CO2 in the Indian Ocean.  Ellen Briggs, David Cervantes, and Stephanie Mumma measure the total alkalinity (TA) and pH of seawater.  Ellen, below, is a PhD student in her final year from UCSD-SIO.  She is also collecting samples to test out a sensor that can measure alkalinity autonomously, which she developed for her PhD thesis.
[Ellen Briggs (UCSD-SIO) measures the alkalinity of seawater in the Main Lab.]
Bob Castle (NOAA-AOML) and Morgan Ostendorf (NOAA-PMEL) measure the concentration of total dissolved inorganic carbon (DIC) on the ship.  Bob has been a sea-going chemical oceanographer for nearly 25 years!  He has sailed the ocean to remote locations and is an expert in making reliable measurements of carbon in the ocean.   

[Bob Castle (NOAA-AOML) prepares a moisture stripper for measuring DIC.]


The four carbonate parameters (TA, pH, DIC, and pCO2 - which is measured with an autonomous system on-board) are needed to fully characterize the carbonate system in the ocean. 

All of the analyses of this cruise provide data that are essential for understanding the ocean’s potential for uptake, transfer, and storage of CO2.  The US GO-SHIP repeat hydrography program affords us the ability to sail the seas and collect the much needed data for understanding the current state of the ocean and the ocean’s response to a changing climate.  Thanks to all the scientists, engineers, and crew members for working so hard to make this cruise a success!!  Till next time J


Tuesday, April 19, 2016

Tracing Water Masses

By Carmen Rodriguez and Patrick Mears
 
Next up for our analyses onboard is the CFCs group.  CFCs (chlorofluorocarbons) are a group of man-made compounds that were introduced as spray aerosols and refrigerants since the mid-1900s.  It was later discovered that they react with ozone in the atmosphere, which depletes the ozone layer at the poles.  Not good.  Fortunately, these gases were eventually banned from production.  But the historical emissions still linger in our atmosphere.
[http://www.atm.ch.cam.ac.uk/tour/tour_images/cartoon.gif]

There are, however, some upsides to CFCs.  1st - there’s almost no natural concentration in the ocean, 2nd - they are relatively inert (non-reactive) in the ocean, 3rd - they have a well-documented emissions history.  This makes CFCs an excellent candidate for “tracing” the movement of water masses in the ocean.  This is done by correlating the concentration measured at any given depth in the ocean to the atmospheric concentration from the past.  Then we can estimate the age of that water mass, which is the time since it was last at the surface. 

The concentration of CFCs in the oceans is small, though, so oceanographers must be very careful with their measurements.  CFCs need to be analyzed with a very high precision and any potential atmospheric contamination should be avoided. 


[Molly Martin and Eugene Gorman running CFCs in the Main Lab.  Picture credit Patrick Mears.]
On this cruise, Molly Martin, Eugene Gorman, and Ben Hickman measure the tracer gases CFCs and SF6 (sulfur hexafluoride) onboard.  They’re surrounded by various overhead lines which supply gases or electrical cables to operate the system.  This is a complicated analysis.  However these “tracers” enable us to determine the age of a water mass, and from this, we can better picture the biogeochemical processes and circulation occurring in the global ocean.

Saturday, April 9, 2016

Laser Scanning for Life


While everyone onboard has a love for the ocean, our specific interests are pretty diverse.  Many of our scientists are focusing on the different chemical compounds in seawater to explore biogeochemical processes, trace water masses, and examine inorganic chemical processes occurring in these waters.  Some scientists are in charge of deploying instruments that collect data of the relative motion and heat exchanged between local water parcels.  There are also a number of scientists onboard who are interested in studying seawater from a biological perspective, from examining the DNA to investigating the community structure of marine microorganisms. 

Steven Baer, a postdoctoral researcher at the Bigelow Laboratory for Ocean Science, is studying phytoplankton ecology and biogeochemistry onboard.  He’s part of a team of four (more on the Bigelow/UCI Lab Group to come!) who collect seawater from the surface ocean down to a depth of around 200 meters – the layer of the ocean where they expect to have the greatest signs of productivity in the ocean.  They filter the seawater to collect microscopic evidence of life.  


[On the aft deck, Steve prepares his samples for analysis.]

From Steven Baer:

I’m broadly interested in how phytoplankton make a living, and their impacts on nutrient cycling in the ocean.  This means I do a number of different types of experiments to determine how microscopic organisms compete for nutrition, and under what conditions different types of phytoplankton succeed.  
While phytoplankton are small, they have an outsized impact on the biology and chemistry of our planet...  Because the oceans are so vast, marine phytoplankton account for at least half of all the oxygen in the atmosphere!  They have a major impact on the fluxes of the primary elemental building blocks of life: carbon, nitrogen, and phosphorus.

However, because phytoplankton are so small, they can be hard to find.  Traditionally, oceanographers would spend a lot of time looking at water samples under a microscope.  With recent advances in optics and processing power, we are now able to automate cell counting procedures, specifically using something called a FlowCAM.  This instrument is akin to something called a flow cytometer, which allows us to enumerate small cells quickly.   Basically, we pass a narrow volume of water past a laser.  When the laser hits a cell with chlorophyll in it, it is picked up by a detector and a picture is taken.  It can do this for large volumes of water, and very accurately.  

[Laser light of the FlowCam system]
This method is an improvement over the microscope, which would require a lot of time and expertise to get an accurate count of microorganisms.  In this case, we can detect cells in the range of approximately 5-300 microns.  For comparison, the width of human hair is about 6 microns, and 1 micron (micrometer) = 1x10-6 = 0.000001 meters!  For phytoplankton (and bacteria) that are smaller (which is most of them here in the surface of the Indian Ocean), we take samples back to the lab on shore and analyze them with an even more powerful laser and instrument setup.

Below, Steve works in the BioLab onboard and preps his FlowCam to capture images of marine microorganisms.

[Images of plankton cells recorded by the FlowCam on 4/2/16] 
These scientists will continue to sample the ocean for signs of marine life throughout this cruise.  Stay tuned for more!

Thursday, April 7, 2016

Nutrients in the Sea


By Net Charoenpong
 
A couple of days ago, we traversed out of the subtropical gyre of the South Indian Ocean, a large oceanographic feature marked by very low productivity in the surface. This vast expanse of the ocean's "desert" is caused by the lack of nutrients. The water there is possibly one of the bluest blues I have ever seen. So, what are nutrients and why are they so important in oceanography? Nutrients are compounds that promote biological growth including nitrogen compounds (like nitrate, nitrite and ammonium), phosphate and dissolved silica. Just like the grass in our backyard, phytoplankton (plant-like drifters of the sea) need nutrients to grow and carry out photosynthesis which converts carbon dioxide to organic molecules and oxygen. Fun fact, half of the oxygen we breathe is produced from the phytoplankton in the ocean. On this cruise, we measured the five nutrients mentioned above.

Our nutrient (shortened to simply NUTS) team (Susan Becker and John Ballard, from Scripps Institute of Oceanography) work tirelessly to sample and analyze almost every bottle from every cast we take.  John showed me the autoanalyzer, the work horse of the NUTS team, which is used to determine the concentrations of these five nutrients. Essentially, the analyses are based on colorimetric methods where you add different chemicals which react with different nutrients to produce colors. The intensity of the colors produced will in turn tell us how much nutrients are in the water. 

 
[Nutrient Autoanalyzer from Scripps.]


Why do we care about nutrients? John explained, "nutrients not only are essential to living organisms, they are also used as tracers for water masses."  The latter are what oceanographers described as the layers of different parcels of water from different origin that stack up on top of one another due to their density difference.


[John Ballard behind the scenes.]


Saturday, April 2, 2016

Ocean Oxygen


By Amanda Fay

As week two comes to a close on the ship we are all settling into our sampling practices, meal, and sleep schedules (listed from most to least important of course).  Discussions at meal times range from inquiries on if everyone’s analysis machinery is working appropriately to lamenting the lack of sea life we have seen thus far on the cruise (read: none. Absolutely none). 

For those scientists who have been onboard for both I08S and continuing on I09N, this week marked their halfway point for their (extra long) cruise. One such scientist is Joseph Gum who is conducting our oxygen analysis onboard.  The oxygen sampler is a tireless workhouse.  Because of the longer analysis times of some parameters being measured onboard, these groups must sample from fewer bottles (depths) every other station so as to not fall behind on analyses and keep up with our packed schedule.  Oxygen, however, is always sampled from the full 36 bottles at every station.  Thankfully Joseph is up to the task.

Sampling from a Niskin bottle.

Since the 1960s, oxygen analysis has been done using the Winkler titration method, a tried and true analysis process that provides an accurate reading of the amount of oxygen in a sample of seawater. Sampling for oxygen requires precision: the specific volume of each beaker goes into the calculation as well as the sampling temperature, which must be read as the water is coming out of the Niskin, to account for thermal expansion.  At sampling, the addition of two compounds fixes the oxygen in the sample to a solid. When ready to titrate, the addition of an acid breaks up the oxygen and prepares it to be measured. 

Joseph adds reagents to "fix" the oxygen in the sample.

Joseph, working in the hydrolab in his white lab coat, is able to titrate all 36 samples during our transit time between stations. Joseph, and the other scientists in the hydrolab, keep their spirits high by listening to standup comedy podcasts and maintain their fitness by doing tricep dips while their samples run.

Titrating to determine the oxygen concentration of seawater.

(Photo credits - Amanda Fay)